Showing posts with label Energy. Show all posts

Thursday, 5 January 2012

Classic investment sales approach required?

Future diverse, affordable and resilient energy provision
I'm all for weaning us off our total reliance on current forms of fuel/supply and in particular those used for much of our electricity generation and distribution. Furthermore, I believe it is critical for a resilient and stable future for generations that come after us.


The Desertec vision is to be applauded and although ambitious it can revolutionise energy and politics in the region;  benefits from playing and winning at such a technology challenge go far beyond building and utilising industrial production and securing a more diverse and resilient energy base.
annotated DiiDesertEnergy - market development digram


Historical context
I realise that the diagram is simply indicative and not to scale. The fundamental flaws in high upfront investment for long-term private sector returns haven't changed from the time private companies created railways all over the UK in the 19th century - and then went bust later.


In the UK, there is a long list of these optimistically based projections to attract investment and achieve great results. The Channel Tunnel and the Channel Tunnel Rail Link in the past have on the whole been great for those involved in constructing and operating the facilities but not great for the people who were the ultimate providers of funds - certainly against the original business cases.

Maybe I'm reading too much into this schematic but the 'investment' case looks quite weak, even before it touches reality, unless you are a utility, technology or manufacturing company.  Based on the above schematic published by DiiDesertEnergy on 5 January 2012 

  • despite a circa 40% increase in the market price for electricity by 2050,  
  • ignoring the substantial displacement in cashflows that will crucify any estimates of Net Present Value
  • and making no particular statements on risks; for example on demand from cutting massive waste, introducing smart grids and off grid supplies. 

the long-term payoff for the 'mean' cost line for the range of technology specific renewables considered is a mix of

  • a 'self sustaining market' for the manufacturing and technology companies and other institutions who form Dii, Medgrid and other and who are presumably the main beneficiaries from the intellectual property derived from these proposed investments made over the next 15-20 years
  • (1) substantial loss on 'investment' in most cases or (2) massive taxpayer contribution (subsidy) towards any return for investors; if 2) occurs which is most likely what reward does the taxpayer receive and what real risk are the other 'investors' taking to achieve their return
Honesty in future returns
Do we really weigh up the pros and cons of this type of long-term investment with an honest appraisal of doing nothing? The opportunity lost from not investing in infrastructure rather than simply the opportunity lost in the use of capital against other uses of that capital. Surely, the functional and engineering success that is Sir Joseph Bazalgette's (and his teams) London sewer network legacy arises from a tremendous foresight, commitment and passion in knowing what great looks like rather than any prediction of the short-term return on investment. 


NB What I like most about the Dii diagram is its honesty - there will be certain technology specific renewables that will be real 'dogs' in terms of an investment proposition and unfortunately we will have no idea what they will be or why. But that is life..

A great case for investing in long-term sustainable and predictable energy from Tidal range (and stream) sources
Given the tidal power technology 

  • exists/works well, 
  • benefits arising fairly predictable and 
  • any environmental impact relatively benign and probably on balance positive to the overall ecology (unless undue weight is given to unscientific and emotionally based avian chirping from organisations that should frankly know better) 

we should have the bottle as a country to go for a Severn and Mersey tidal power (barrage) schemes as a minimum. 
Which leader will back that idea? It would certainly hot up the debate about what we need to do, and the choices that must be made, as a nation to really address the economic, social and behavioural challenges it will take to be a leading and affordable low carbon economy that's fit for a sustainable future.


NB 
Desertec stands for the overall vision of supplying a large part of the world with sustainable power, by tapping the energy potential of the desert. Dii (launched as "Desertec Industrial Initiative") is a private industry consortium working towards enabling this vision in Europe, the Middle East and North Africa (EUMENA)


Photostream http://www.flickr.com/photos/diidesertenergy/ 
Dii market development graphic http://www.flickr.com/photos/diidesertenergy/6635132251/
Dii indicative map of sites http://flic.kr/p/9t1AiG 

Wednesday, 25 May 2011

Selected innovators at 2011 Sustainability Live

Lontra Blade compressor () first uses: waste water aeration, oil free industrial air compressors and automotive superchargers.
PyroPure (), Ethos Energy () also Mitie has published paper on potential (); for hazardous waste pay back can be only c. 2-3 years.
Oxford Photovoltaic's solar cell technology uses cheap, abundant, non-toxic & non-corrosive materials screen printed on glass. ().
KiWiPower helps companies remove stress in National Grid by reducing electricity consumption when most polluting & expensive. National Grid pays for service as reduces peak demand ()


Oxford PV and Lontra certainly looked quite unique; the former still working to finalise details; improve efficiencies (today 5% but aiming for 20%), scale up and guarantee a 25 year life span or something equivalent to the glazing facade in which they will be placed etc. Very exciting though the range of applications and colours etc..


http://www.sustainablebusiness.com/index.cfm/go/news.main

Thursday, 21 April 2011

China's 12th Five Year Plan: A Preliminary Look

Jonathon Porritt (forum for the future and Guardian) gave an excellent lecture and kick to do more, entitled City, Nations and Global Capital: Turning Sustainability into Reality, at the Institution of Civil Engineers (ICE) on 4 April. 
Among other issues he did point out that this plan was worth reading and that it had a great deal of the right direction and leadership in it and as a better example of what needs to be planned and done than democratic countries are currently managing to show. So I thought I would read into it a little..
China's 12th Five Year Plan: A Preliminary Look
From article in Opinion Maker Feb 25, 2001. http://goo.gl/HVKuj

Monday, 6 December 2010

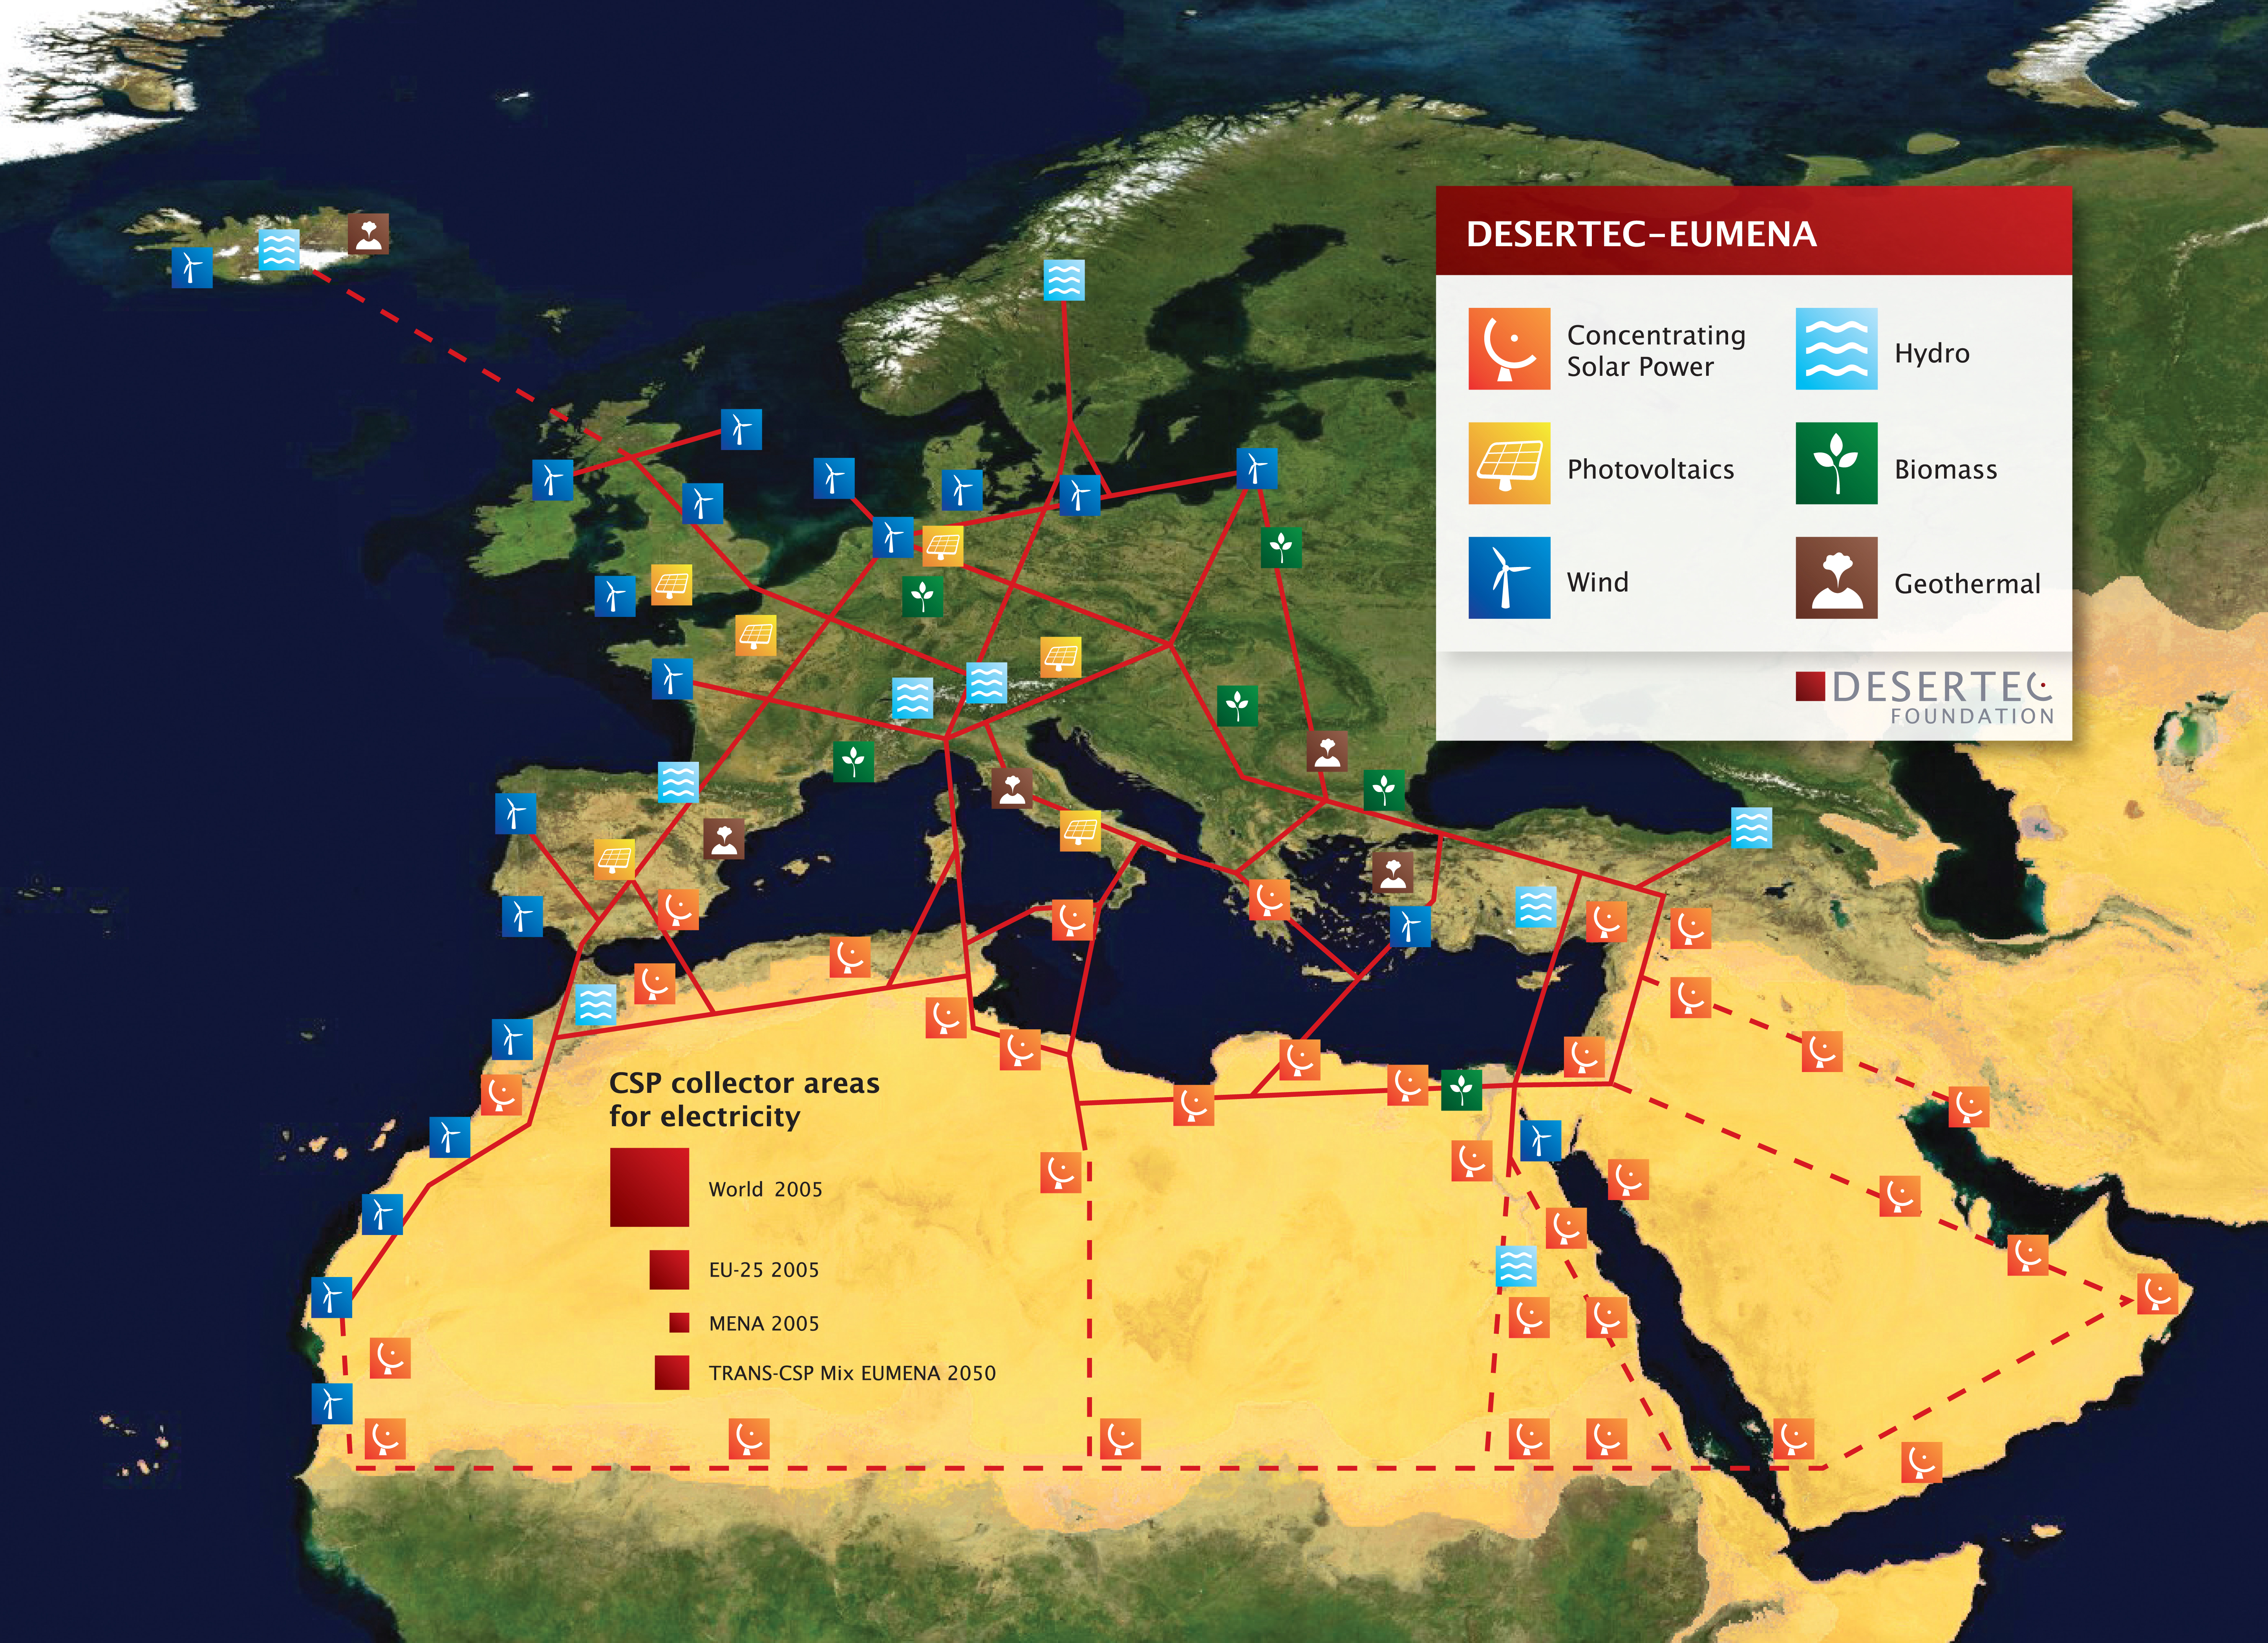
Desertec Foundation going for fast global implementation of concept: clean power from deserts for climate protection and global energy security.

"Within 6 hours deserts receive more energy from the sun than humankind consumes within a year" Dr Gerhard Knies.
The DESERTEC Foundation was established on 20 January 2009 as a non-profit foundation with the aim of promoting the implementation of the global DESERTEC Concept "Clean Power from Deserts" all over the world. 
Sketch of possible infrastructure for a sustainable supply of power to Europe, the Middle East and North Africa (EU-MENA) (Euro-Supergrid with a EU-MENA-Connection proposed by TREC). For illustration: the red squares indicate the space needed for solar collectors to produce the present power for the world (18.000 TWh/y, 300x300 km2), for Europe (EU 3.200 TWh/y, 125x125 km2) and for Germany or MENA (Middle East and North Africa, about 600 TWh/y, 55x55 km2).
The square labelled "TRANS-CSP Mix EUMENA 2050" indicates the space needed for solar collectors to supply the needs for seawater desalination and about two-thirds of the electricity consumption in MENA in the year 2050 and about one-fifth of the European electricity consumption by Concentrating Solar Thermal Power Plants (2,940 TWh/y in total).  5 March 2009. Source: http://www.desertec.org/downloads/DESERTEC-Map_large.jpg . Author: TREC.  This file is licensed  under the Creative Commons Attribution-Share Alike 2.5 Genericlicense.

Saturday, 23 October 2010

Keeping abreast of the winds of change | New Civil Engineer | DECC UK Electricity Generation Costs update (June 2010)

An interesting viewpoint from EC Harris published on 14 November, Keeping abreast of the winds of change | Features | New Civil Engineer, which provide an overview of how life cycle costs can be minimised whilst maintaining and sustaining assets' integrity.
EC Harris has also published an expert article entitled 'An Holistic view of value drivers will improve the return on investment for offshore wind farms'.
'The cost of delivering offshore wind projects is rapidly reaching £3.8 million per megawatt; at a time when investors are looking for costs of £2 million per megawatt to allow a viable return on investment. It will be a huge task to reduce costs by almost 50% when there is significant cost pressure due to market immaturity and supply chain inefficiencies.'
In this article they note, from their cross sector experience, that reducing costs is not the only way to improve the return on investment although it is still a very important one.
'The three main levers that can be pulled are the optimisation of generation, the impact of the prevailing tariff system and timely and efficient connection. All of these factors need to be addressed if the industry is to be successful in providing a viable return on investment.'
DECC UK Electricity Generation Costs update 
On Tuesday this week I attending a seminar by Dr Guy Doyle (Chief Economist, Energy and Carbon at Mott McDonald) who was presenting the findings contained within the Department for Energy and Climate Change (DECC)'s June 2010 update on the UK's Electricity Generation Costs. This was an interesting presentation on levelised costs, the lifetime discounted cost of an asset expressed in cost per unit energy produced, for a range of main technologies. This report is one that has been regularly updated and records and forecasts the levelised costs for projects started in 2009, 2013, 2017, 2023. 
The forecasts take into consideration a range of factors such as a DECC view of the accelerating higher forward costs of carbon (central projection assumed to rise to £200/tonne in 2050 vs £30/tonne by others - today it is circa £12/tonne) and a Mott McDonald view on the technology progress and First of a Kind (FOAK) premiums. 
'For most mature technologies the main drivers of costs are market conditions and commodity prices, with some discounting for installations with multiple units.  For these technologies, the main scope for technical progress is in the application of best practice construction management.  Even though the UK has yet to build an advanced supercritical coal plant, there is likely to be comparatively little difference (less than 10%) between the first of a kind (FOAK) and the nth of a kind (NOAK) plant.  CCGT (Combined Cycle Gas Turbine) technology is already at the NOAK level, as is onshore wind.  Offshore wind still has some significant learning, especially in the area on cost effective foundations/anchoring and in reducing maintenance and servicing costs.  Moving to deeper water and further offshore means wind faces a moving target as this tends to require new untried technical solutions. 
Third generation nuclear plants and especially CCS are at an earlier stage, although for the former there are probably easier wins to be had in terms of improved project management than in technology changes.'  
The resultant projections are interesting when taken in the context of the two EC Harris articles,  the anticipated investment in Crown Estate and Scottish wind programmes and the Energy Technology Institute's 2010 Marine Energy Technology Road MapI have included 2009, 2013 and 2023 start dates in order to note the trends the report identifies. 
DECC report: Levelised costs of main technologies for projects started in 2009 - mix of FOAK and NOAK (£/MWh)
Round 3 Wind FOAK (c. £180/MWh) is not only over twice cost of Gas CCGT (c. £80/MWh) started in 2009 but is also significantly higher than the average cost of energy in generation today at £45/MWh! Even with 2 no ROC (Renewable Obligation Certificates) it must struggle to be viable as FOAK technology and will need a real focus on cost reduction, optimisation of generation, the impact of the prevailing tariff system and timely and efficient connection (see EC Harris notes above).

Wednesday, 21 July 2010

BERR UK Energy flow charts - a useful resource

The Energy flow chart 2008[filetype:pdf filesize: 376.24Kb] illustrates the flow of primary fuels from home production and imports to their eventual final uses. DECC shows them in their original state, and after being converted into different kinds of energy by the secondary fuel producers. The flows are measured in million-tonnes of oil equivalent (mtoe), with the widths of the bands approximately proportional to the size of the flow they represent.
The next update, in summer 2010, will contain the 2009 UK energy flows.
According to Wikipedia  1 MWh = 0.086 toe, therefore 1 TWh = 0.086 mtoe
So an annual year output of say a Cardiff-Weston Tidal Barrage at 17 TWh would be equivalent to 1.5 mtoe. This is above the same as the consumption of the UK's Iron and Steel industry but perhaps not all generated at the right time!


NB Best place to view chart is PDF on BERR website above but it is shown below to show concept.

Sunday, 28 March 2010

Low Carbon Construction - Innovation & Growth Team - Emerging Findings

....a couple of recent HMG reports to look at - links are in the titles


Contents

1. Executive Summary.
2. Introduction
3. Industry-Wide Issues
4. Major Projects
5. Housing
6. Non-Domestic Buildings
7. Distributed Energy
8. Infrastructure
9. 2050 Group
10. Future Work
11. Industry Engagement
12. Acknowledgements


Annexe A: A process map for market transformation
Annexe B: Summary of recommendations and propositions
Annexe C: Members of the IGT Steering Group and Working Groups

Tuesday, 12 January 2010

Peak Energy - Tapping source of power from oceans


Interesting blog covering range of topics including some tidal ideas - although loading on this tidal flow structure must be immense. 


Tidal Power - Woodshed Technologies Ltd, TGL and other links

Info mainly sourced from websites.......
CleanTechCom Limited is a Scottish registered company formed in 2006 by John Griffiths and Steve Hastings. This company is today wholly owned by Woodshed Technologies Limited.
They are involved in the Department for Energy and Climate Change (DECC) Severn Embryonic Technologies Scheme (SETS) funded support into Severn Tidal Fence through the Severn Tidal Fence Consortium.

The STF Consortium is headed by IT Power. CleanTechCom has brought additional co-financing to the study, which is also supported by technical expertise from Marubeni (Europe), Metoc, NaREC, BMT Fleet Technology, Edinburgh University, and Sigma Offshore.


Thursday, 18 June 2009

Energy requirements of different forms of passenger transport.

more Sustainable Energy - without the hot air David JC MacKay
Figure 20.23. Energy requirements of different forms of passenger transport. The vertical coordinate shows the energy consumption in kWh per 100 passenger-km. The horizontal coordinate indicates the speed of the transport. The “Car (1)” is an average UK car doing 33 miles per gallon with a single occupant. The “Bus” is the average performance of all London buses. The “Underground system” shows the performance of the whole London Underground system. The catamaran is a diesel-powered vessel. I’ve indicated on the left-hand side equivalent fuel efficiencies in passenger-miles per imperial gallon (p-mpg).Hollow point-styles show best-practice performance, assuming all seats of a vehicle are in use. Filled point-styles indicate actual performance of a vehicle in typical use.See also figure 15.8 (energy requirements of freight transport).

Sunday, 26 April 2009

Google Powermeter

What Google is Doing

Google PowerMeter, now in prototype, will receive information from utility smart meters and energy management devices and provide anyone who signs up access to her home electricity consumption right on her iGoogle homepage. The graph below shows how someone could use this information to figure out how much energy is used by different household activites.

PowerMeter annotated graph
Analyze:
Get better information about how you use energy and what you can do to be more efficient.
Save:
Reduce your energy bills and carbon footprint by making smart decisions about your energy use.
Share:
Strike up a little friendly competition to see how your energy consumption compares to your friends and neighbors.

The Conservatives' plan for a 'Green technology recovery'


George Osborne has set out a series of measures that could be introduced in next week’s Budget and would bring about a green technology revolution in Britain.
The Shadow Chancellor stressed, “The Budget is not just an opportunity to help people now; it’s also a chance to chart a new course for the future.”

And he outlined a series of policies to “kick-start a green recovery” built on new technologies developed and manufactured in Britain:
  • A £6,500 energy efficient entitlement for every home in Britain
  • Funding at least three carbon capture and storage pilots (2)
  • The introduction of feed-in tariffs (4) and smart meters (3) to encourage homes to microgenerate using wind turbines and solar power
  • A national recharging network for electric vehicles (5)
  • Beginning work on a new high-speed rail network (6)
  • Investing in the creation of an electricity internet (7)
  • Providing government loan guarantees to companies investing in green technologies
  • Creating the world’s first environmental trading market
  • Introducing a network of Marine Energy Parks
  • Building an offshore DC cable network (10)
George stressed their plan “could transform Britain”: “It would unleash £30 billion of new private sector investment, without adding a penny to the national debt. It would lay the path to a greener future. And it would help build a future economy where we save and invest for tomorrow instead of borrow and spend for today.”

Saturday, 25 April 2009

Tidal Power - David JC MacKay; the beauties of tide

extracted from http://www.inference.phy.cam.ac.uk/withouthotair/c14/page_87.shtml
Sustainable Energy - without the hot air

Beauties of tide

Totting everything up, the barrage, the lagoons, and the tidal stream farms could deliver something like 11 kWh/d per person (figure 14.10).

Tide power has never been used on an industrial scale in Britain, so it’s hard to know what economic and technical challenges will be raised as we build and maintain tide-turbines – corrosion, silt accumulation, entanglement with flotsam? But here are seven reasons for being excited about tidal power in the British Isles.
1. Tidal power is completely predictable; unlike wind and sun, tidal power is a renewable on which one could depend; it works day and night all year round; using tidal lagoons, energy can be stored so that power can be delivered on demand.

2. Successive high and low tides take about 12 hours to progress around the British Isles, so the strongest currents off Anglesey, Islay, Orkney and Dover occur at different times from each other; thus, together, a collection of tide farms could produce a more constant contribution to the electrical grid than one tide farm, albeit a contribution that wanders up and down with the phase of the moon.
3. Tidal power will last for millions of years.
4. It doesn’t require high-cost hardware, in contrast to solar photovoltaic power.
5. Moreover, because the power density of a typical tidal flow is greater than the power density of a typical wind, a 1 MW tide turbine is smaller in size than a 1 MW wind turbine; perhaps tide turbines could therefore be cheaper than wind turbines.
6. Life below the waves is peaceful; there is no such thing as a freak tidal storm; so, unlike wind turbines, which require costly engineering to withstand rare windstorms, underwater tide turbines will not require big safety factors in their design.
7. Humans mostly live on the land, and they can’t see under the sea, so objections to the visual impact of tide turbines should be less strong than the objections to wind turbines.

Mythconceptions

Tidal power, while clean and green, should not be called renewable. Extracting power from the tides slows down the earth’s rotation. We definitely can’t use tidal power long-term.

False. The natural tides already slow down the earth’s rotation. The natural rotational energy loss is roughly 3 TW (Shepherd, 2003). Thanks to natural tidal friction, each century, the day gets longer by 2.3 milliseconds.
Many tidal energy extraction systems are just extracting energy that would have been lost anyway in friction. But even if we doubled the power extracted from the earth–moon system, tidal energy would still last more than a billion years.

Notes and further reading


page no.
82The power of an artificial tide-pool. The power per unit area of a tide-pool is derived in Chapter G, p311.

Britain is already supplied with a natural tide-pool . . . known as the North Sea. I should not give the impression that the North Sea fills and empties just like a tide-pool on the English coast. The flows in the North Sea are more complex because the time taken for a bump in water level to propagate across the Sea is similar to the time between tides. Nevertheless, there are whopping tidal currents in and out of the North Sea, and within it too.

83The total incoming power of lunar tidal waves crossing these lines has been measured to be 100 kWh per day per person. Source: Cartwright et al. (1980). For readers who like back-of-envelope models, Chapter G shows how to estimate this power from first principles.

84La Rance generated 16 TWh over 30 years. That’s an average power of 60 MW. (Its peak power is 240 MW.) The tidal range is up to 13.5 m; the impounded area is 22 km2; the barrage 750 m long. Average power density: 2.7 W/m2. Source: [6xrm5q].

85The engineers’ reports on the Severn barrage...say 17 TWh/year. (Taylor, 2002b). This (2 GW) corresponds to 5% of current UK total electricity consumption, on average.

86Power per unit area of tidal lagoons could be 4.5 W/m2. MacKay (2007a).

Sustainable Energy - without the hot air

Contents

Dedication Preface (p.viii) (p.ix)

10-page synopsis: (pdf)

I Numbers, not adjectives [pdf]
1 Motivations [html]
2 The balance sheet [html]
3 Cars [html]
4 Wind [html]
5 Planes [html]
6 Solar [html]
7 Heating and cooling
8 Hydroelectricity [html]
9 Light [html]
10 Offshore wind [html]
11 Gadgets [html]
12 Wave [html]
13 Food and farming [html]
14 Tide [html]
15 Stuff [html]
16 Geothermal [html]
17 Public services [html]
18 Can we live on renewables?
II Making a difference [pdf]
19 Every BIG helps [html]
20 Better transport [html]
21 Smarter heating [html]
22 Efficient electricity use
23 Sustainable fossil fuels?
24 Nuclear?
25 Living on other countries' renewables?
26 Fluctuations and storage [html]
27 Five energy plans for Britain [html]
28 Putting costs in perspective [html]
29 What to do now [html]
30 Energy plans for Europe, America, and the World
31 The last thing we should talk about [html]
32 Saying yes [html]
IIITechnical chapters
A Cars II
B Wind II
C Planes II
D Solar II
E Heating II
F Waves II
G Tide II
H Stuff II
IVUseful data
I Quick reference
J Populations and areas
K UK energy history